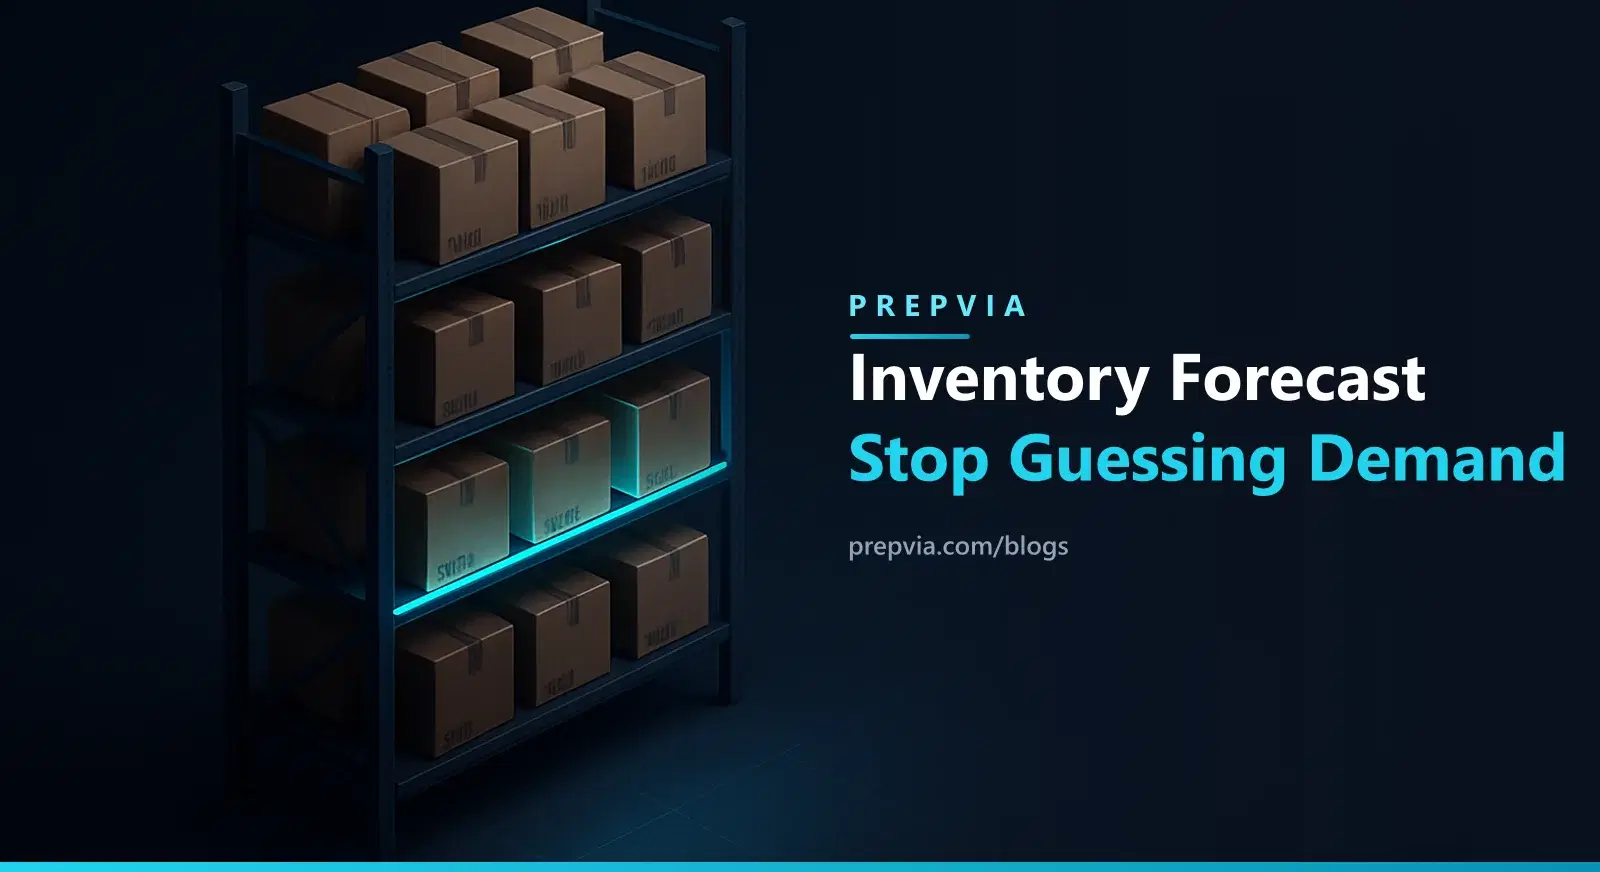
The Inventory Problem Nobody Talks About
I’ve watched hundreds of Amazon sellers build impressive product lines, nail their PPC strategy, and still bleed money. The reason is almost always the same: they guess their inventory instead of forecasting it.
It sounds boring. Nobody starts selling on Amazon because they love spreadsheets and reorder calculations. But I’ve come to believe that inventory forecasting is the single highest-leverage skill in this business. Get it right and everything else gets easier. Get it wrong and you’re either staring at empty listings or writing checks to Amazon for storage fees on units that aren’t moving.
The math is brutal. A stockout doesn’t just cost you the missed sales for that day. Amazon’s algorithm notices. Your organic ranking drops. Your competitors absorb the traffic you spent months building. One week out of stock on a top SKU can take 3 to 4 weeks of recovery to climb back. That’s not a setback. That’s a quarter gone.
The Other Side of the Coin Is Just as Painful
Overstocking feels safer. At least you have product to sell, right? But capital sitting in a warehouse isn’t capital. It’s a liability wearing a costume.
Amazon storage fees climb during peak months, October to December, to $2.40 per cubic foot for standard size and $1.40 for oversize, before the storage utilization surcharge. The $6.90 per cubic foot figure sellers quote is a different line item: the aged inventory surcharge on units sitting 12 to 15 months, charged all year long. If you’re holding 90 days of inventory on a slow mover, you’re paying rent on dead weight while your cash flow suffocates. I’ve seen sellers with six-figure revenue and negative cash flow because their warehouse was full of “just in case” inventory.
And then there’s your IPI score. Amazon’s Inventory Performance Index is their way of grading your inventory management. There is no 400 cutoff anymore. Your IPI score is one input into the monthly FBA capacity limit, along with sales history, seasonality, ASIN forecasts, scheduled deals and fulfillment center capacity, and if you blow past that limit Amazon blocks new shipments instead of charging an overage fee. It’s a feedback loop: bad forecasting leads to bad IPI, which leads to less capacity, which makes your forecasting even harder.
Historical Data Is Your Foundation, Not Your Crystal Ball
Every decent forecast starts with historical sales data. Pull 90 to 180 days from Seller Central and calculate your average daily sales velocity per SKU. That number is your baseline.
But here’s where most sellers stop, and it’s where they get burned. A flat average doesn’t account for the real world. Q4 isn’t Q2. Prime Day isn’t a normal Tuesday. Back to School in August drives completely different demand patterns than February.
I think of seasonality like tides. You can see the ocean every day and still get caught if you don’t study the calendar. The sellers who win are the ones who overlay their daily velocity with seasonal coefficients. They know that their kitchen product does 2.4x in November and 0.6x in January. They plan for it in July.
24 to 36h prep. 35-hour end-to-end guarantee or the prep is free. Net-30 terms. From 50 units to full truckloads.
The Replenishment Equation Most Sellers Get Wrong
Ask a new seller how long it takes to restock and they’ll tell you their supplier’s lead time. That’s maybe a third of the answer.
Your real replenishment cycle is supplier lead time plus prep time plus transit to Amazon plus check-in time. If your supplier takes 14 days, your prep center takes 5 days, transit takes 7 days, and Amazon check-in takes 5 days, your total cycle is 31 days. Not 14.
This is where a lot of money gets left on the table. If you can cut your prep time from 5 days to 2 days, you just shaved 3 days off your entire cycle. That means you need less safety stock. Less safety stock means less capital locked up. Less capital locked up means you can invest in new SKUs or better PPC. It compounds.
Safety Stock Is Insurance, Not a Strategy
Every forecast is wrong. The question is how wrong and in which direction. That’s what safety stock is for.
A common formula: take your maximum daily sales, multiply by your maximum lead time, then subtract your average daily sales multiplied by your average lead time. The difference is your safety stock buffer.
But I’ve seen sellers treat safety stock like a security blanket. They pad it 50% because they’re scared of stockouts. That fear is expensive. A smarter approach is to right-size your safety stock based on actual demand variability. If your sales velocity is consistent within 10%, you don’t need 30 days of buffer. You need 7 to 10.
The faster your prep and fulfillment pipeline moves, the less safety stock you need. A seller with a 48-hour prep cycle can afford a thinner buffer than one waiting 7 days for prep alone. Speed in the supply chain directly translates to capital efficiency.
Tools That Actually Help
You don’t need to do all of this in your head. Seller Central’s own inventory reports and restock recommendations are a decent starting point, though they tend to be conservative.
For sellers doing more than 200 orders a day, dedicated tools start to make real sense. RestockPro is solid for reorder planning and lead time tracking. SoStocked gives you visual forecasting with customizable seasonal profiles. Forecastly integrates directly with your Seller Central data and automates a lot of the math.
As I see it, the tool matters less than the discipline. A seller who reviews their forecast weekly in a spreadsheet will outperform someone who bought a $300/month tool and checks it once a quarter. The habit is what separates profitable sellers from stressed ones.
The Unsexy Truth About Forecasting
I believe the best Amazon businesses are boring in all the right places. Product selection gets the glory. Marketing gets the attention. But forecasting is the infrastructure that holds it all together.
The sellers who scale past 7 figures aren’t smarter about products. They’re smarter about inventory. They know their numbers cold. They know their replenishment cycles down to the day. They know when to push and when to hold.
Forecasting isn’t about predicting the future perfectly. It’s about being less wrong than you were last month, and building a supply chain fast enough to absorb the mistakes. That’s the game. And it’s a game worth getting good at.
Talk to PrepVia about faster prep cycles →